Why don't you go back?
NYCDensityMapper - Showing the Process
Using Python, SQL, and ZoLa, I made a map of NYC's housing density by the block, with some interesting results. See my creation process and methodology!
Skip Here for the Maps
It all began when I was reading Vishaan Chakrabarti's A Country of Cities and saw a passage from his talk of hyperdensity that piqued my interest. It went something along the lines of "strong cities with reliable metro transit cannot work unless they achieve a density of 30 residential units per acre", and of course, on the other side of the page was a cute graphic of what 30 units per acre could look like on a city block.
My immediate first thought was, "that seems a little unfair, doesn't it? 30 might not be a possible density for many urban blocks." Not knowing anything about how dense an average city block was, or what the hell an acre was (I still don't really know what an acre is), I thought that this was a brash, extreme request. I decided that I wanted to look into this myself.
SPOILER: I WOULD BE IMMENSELY, INSANELY WRONG. You'll see what I think should be minimum urban density by the end of this post.
So, wait, let's run this back a little. What does density have to do with strong cities? (warning for those who read Country of Cities: this is going to be some STRONG rephrasing of essentially the entire book's thesis. Sorry, but not sorry, neither Chakrabarti or I hold copyright on basic climate science and urban planning.)
Why Density Matters
There are essentially two main reasons why density is essential for cities: human sustainability, and environmental sustainability.
1. The Human Angle
We're selfish beings, so let's begin with the human benefits. Without going into excess detail, higher housing density allows for more innovation, productivity, and job growth per unit of area. People are better able to connect with one another, find work, and provide niches of services that would otherwise be impossible to provide. (name one small town with a luxury car dealership, not that you'd ever find me in one of those places) As a result, cities produce MUCH more output per person than rural or suburban areas. While this is erroneously commonly misinterpreted to mean that poor people should generally be unable to live in cities, the opposite is true. A multitude of opportunities for each unit of area is the exact thing poorer people need to rise up in the economic ladder and find success. A multitude of housing types for each unit of area with a broad range of prices is the exact thing that working-class families need to both be able to afford housing, and connect with people who can present them with opportunities.
Density breeds diversity as well, because oftentimes people of color and immigrants find dense cities places that are most likely to accept their identity and culture, and to provide new-coming workers with a place to grow their careers. In every major city in even a white-majority country like America, there are blocks and neighborhoods with a rich character of the diversity that cities naturally encourage. From Chinatowns and Koreatowns to Littles Italy, Brazil, Dominican Republic, Russia, and more, dense cities will have communities for people of many backgrounds to display their culture, food, and language, which allows more groups of people to connect, form social bonds, and just enjoy life.
Speaking of enjoying life, density provides people with the possibility of numerous types of transport to work, play, and needs, all while making the distance shorter. Try getting to work or the grocery store on foot or on bicycle in New York City, and then try doing it in Levittown, Pennsylvania. Let me know how that goes. And getting back to Chakrabarti's point, the ridership numbers for public transit increase past the point of necessity, making metros, buses, and trams a more reasonable choice for denser areas. All of these travel ease benefits that denser areas provide allow for more people to get out of their cars, get on foot and on their bicycles, and onto transit, causing them to lead a healthier lifestyle, not even intentionally! A consciously healthy person who lives in a suburb and a completely oblivious goober who just walks everywhere in their city will have a nearly identical bill of health, even though the city dweller put almost no effort into "exercising". City life is the exercise: it's the gym of life. Obesity rates are consistently lower in cities, especially dense ones, than in rural and suburban areas.
2. The Climate Angle
In the last half century, it has become abundantly clear that the way of life of much of the United States and other developed nations around the world has become unsustainable for the future of the planet. Excessive consumption of fossil fuels have driven much of what we know now as the greenhouse effect, where trapped excess carbon dioxide traps heat within the planet's atmosphere, increasing global temperatures and causing extreme weather events to become more likely, such as heat waves, droughts, storms, earthquakes, and more.
Reduction of fossil fuel consumption is urgent if we want to stay on track to prevent catastrophic warming, and many of the globally suggested ways of doing so can help. We could all simply consume less products, buy less things that we may not need. We could divert our energy consumption to something less carbon-intensive, like solar or wind power. We could achieve this sort of power usage in our own lives by perhaps buying solar panels for our homes, or electric cars.
But what if that wasn't enough? What if our built environment, not just our lifestyles, made our consumption fundamentally incompatible with sustainability? Many of our resources in supplying water, plumbing, electricity, and other essential services are spread out across sparse residential areas across the country, with densities commonly under 15 units per acre. Why does this matter? Because as it turns out, even when consuming "unsustainably", those who live in denser, urban environments still emit less carbon dioxide per capita than those who live in sprawling, suburban environments with all the renewable amenities.
As such, density is one of humanity's true remaining silver bullets to reduce our carbon footprint. A denser city means a more environmentally sustainable one, a less carbon intensive one, a less resource-intensive one.
My Process
So here I am, wondering what exactly the housing density of a random block in New York City looks like. Luckily, there's a neat little tool that a bunch of nerds in city government (likely me in around ten years) have bestowed upon us internet users: the ZoLa, aka the Zoning and Land Use Map of NYC. In extruciating detail, this map shows the land use and information of every square inch of the city, down from building floor count to park acreage.
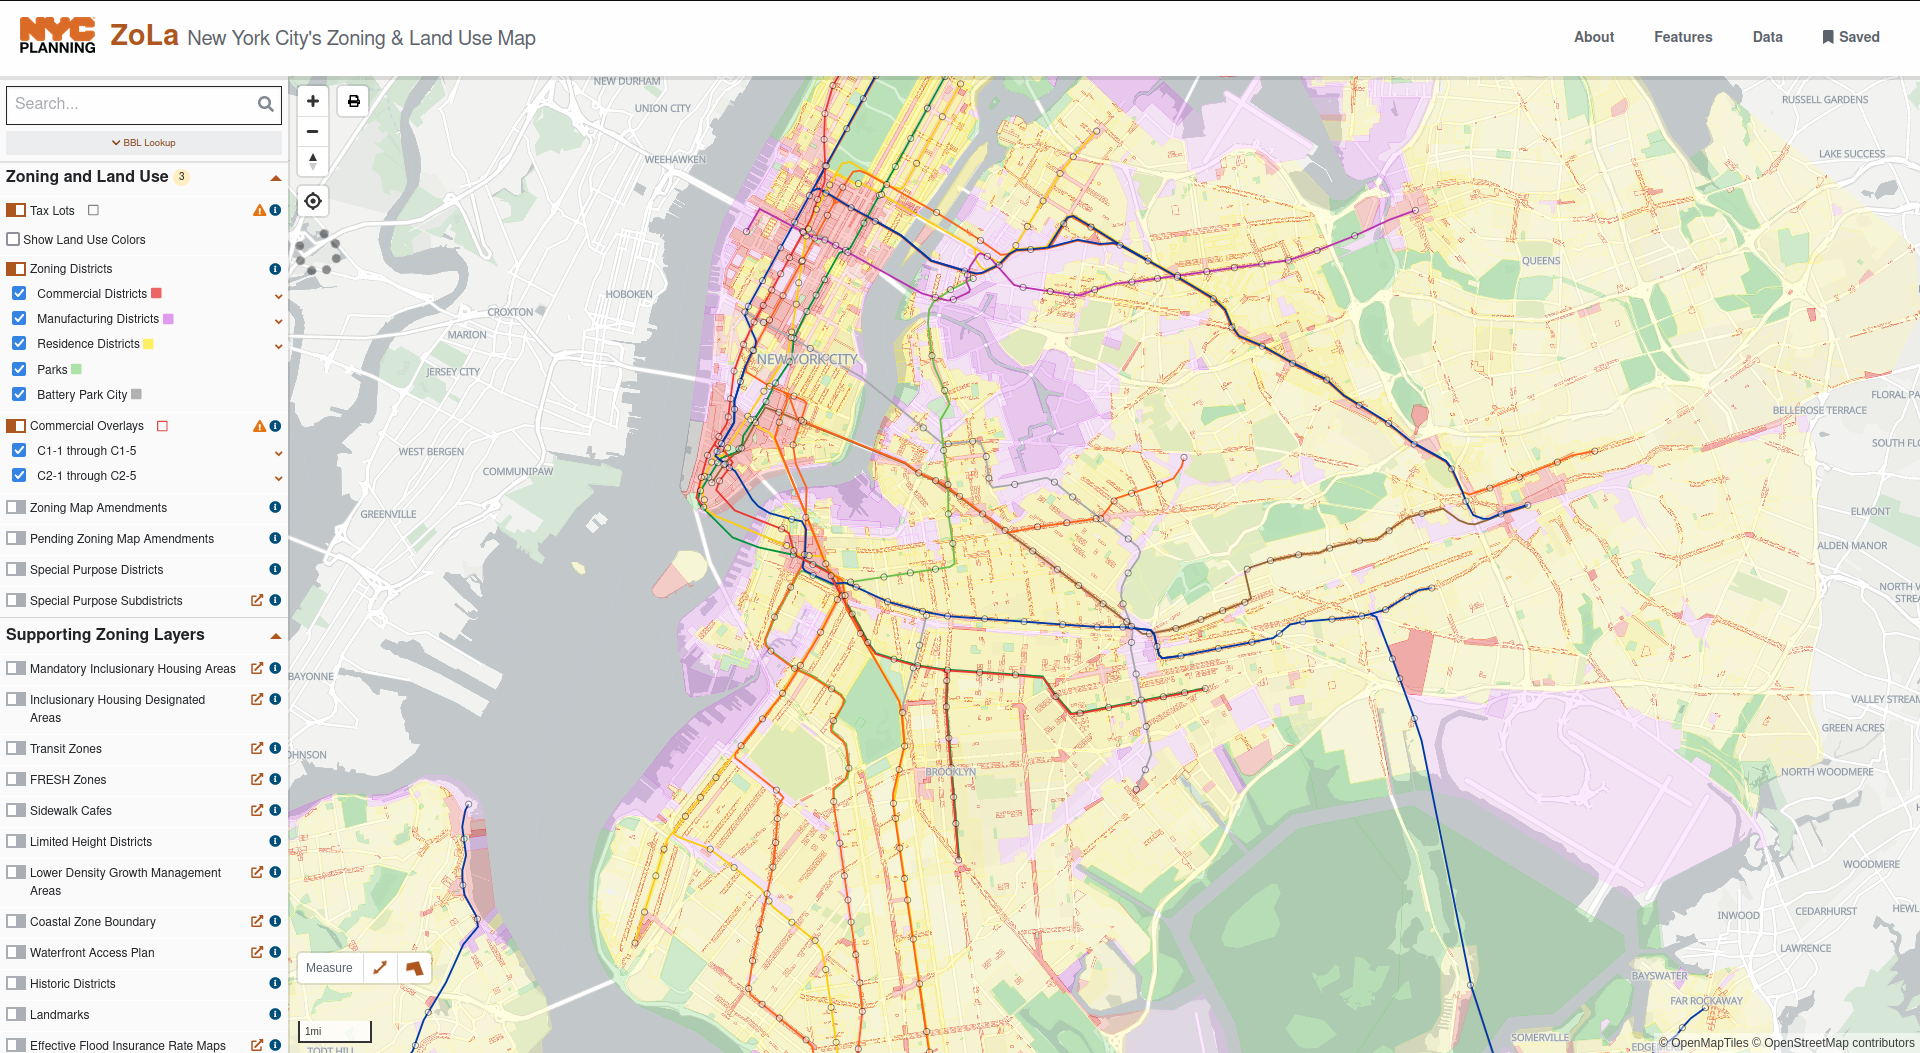
I went to some random block in Park Slope, between 4th and 5th Streets and 5th and 6th Avenues. Covered by three to four-story brownstones, and the F/G/R trains a couple streets away, it's about as average in character as any other Brooklyn block. I manually clicked on every building on the block, went to the information section, added up the square footage of the lot and the number of residential units, and divided the latter total by the former total to get my number.
After several minutes of breaking my fingers on my phone's calculator and browser, I arrived at 69.5 units per acre (nice).
I then imagined how nice it would be to have data on ALL such blocks, in a nice looking map, showing the density gradient of New York's urban fabric in the most detailed possible way.
But I thought to myself: "How is this going to be even NEARLY scaleable? There's hundreds of thousands of blocks and MILLIONS of lots..."
I had to make some sort of systematic solution to quickly process every lot in every block if I wanted a map of NYC that takes a few seconds or minutes to make, and not a few years. And what better way to convert huge data into visuals fast than using code?
The Data Mason... What Does it Mean???
First things first, I had to get the data from ZoLa somehow if I wanted to do anything systematic in making a map of NYC's density. No matter what kind of godly code I write, it will be useless without a clean and fast way to get data for every lot in the city.
I won't make this very long because there is, in fact, a longer, more detailed guide available. Essentially, I used the same data request from the NYC planning department's database that ZoLa uses. If we want data from databases, there are two important things to keep in mind: permission, and method.
An API, or an Application Programming Interface, connects two programs, and more importantly for us, their data. This is generally how services connect you, the user, to the data that you may want, in their servers. When ZoLa makes a request to access the NYC planning department's data on a particular lot, it does so using an API.
This particular database is written, and more importantly for us, accessible, in SQL. This is a programming language meant to store information, so many databases use it.
Combining our two important aspects of database use, permission and method, we have deduced that we will need to make an API request with a SQL query.
Here's a longer form of what I'm about to summarize, and I could not have done this without a friend of mine, a fellow David.
He discovered that upon using Inspect Element, a tool to see how a webpage is wrriten and styled, one can actually see the API request with the SQL queries in the Network view. After modifying the queries a little bit and playing with the results in Insomnia, a program that streamlines the API process, we were able to make a Python program: a request that captures all lot data in the city. We ran it with one command in our computer's terminal, and it downloaded all the data in under a minute.
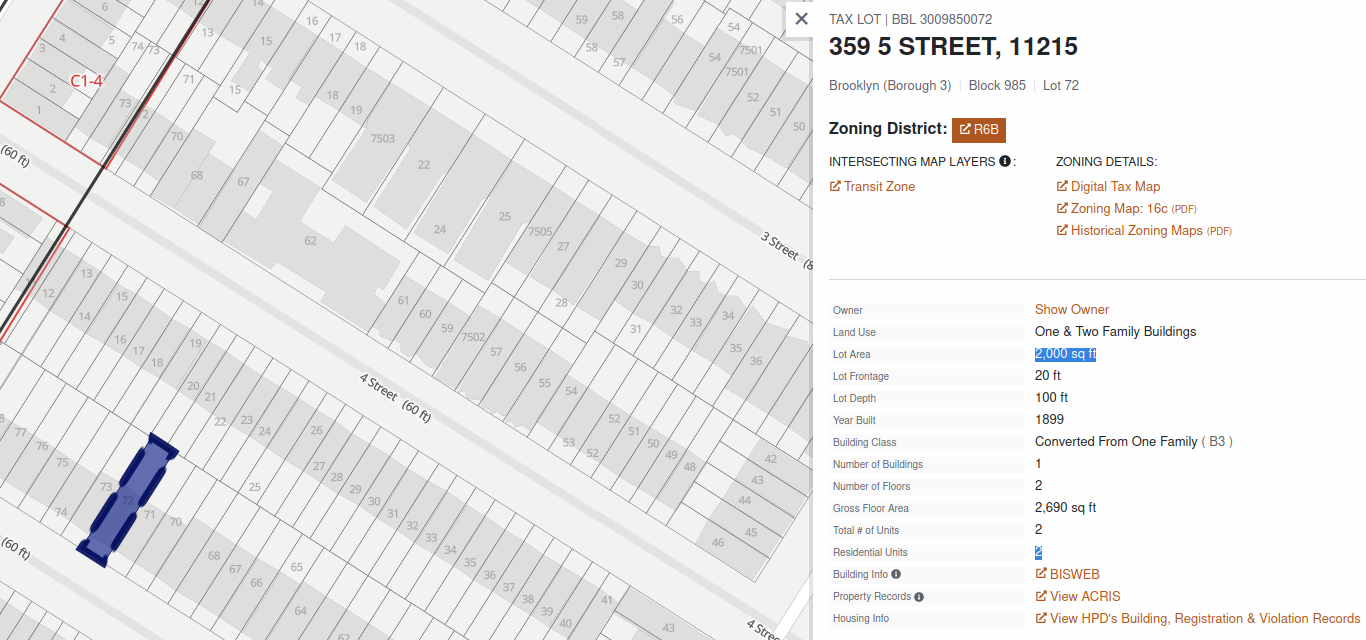
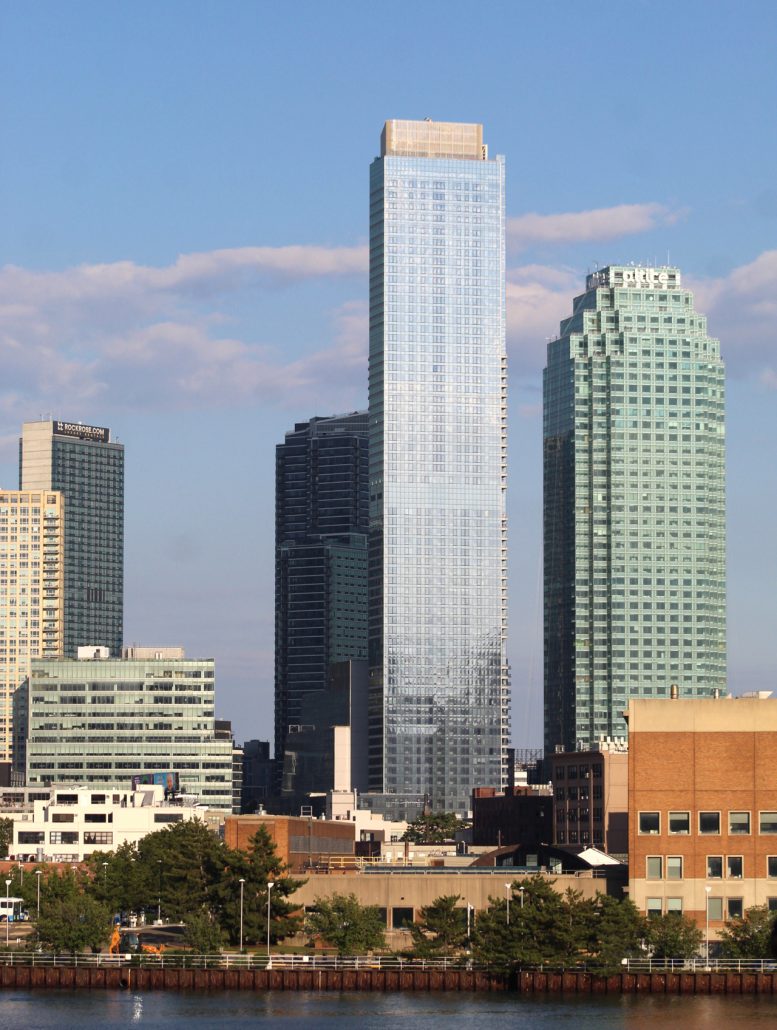
I had to clean up some of this data at first, because it was primarily filled with inaccuracies. My favorite of these were buildings that were obviously not as dense as they claimed to be. My favorite of these favorites was the error surrounding 23-15 44th Drive, AKA the Court Square Skyline Tower, a luxury 68-floor apartment skyscraper.
Notice how many residential units ZoLa claims this building to have.
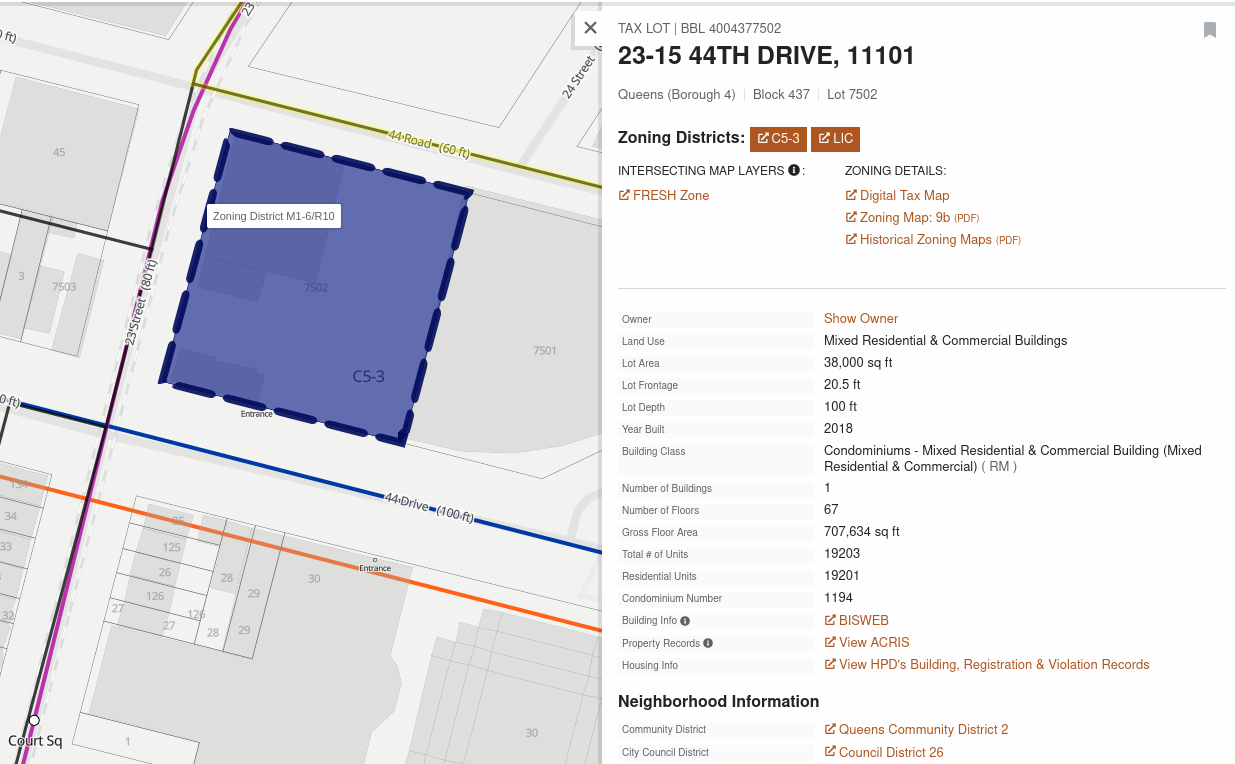
19201, while impressive-sounding at first, does not make ANY sense when you think about it for more than two milliseconds. How the hell do you get upwards of 200 units per floor? Not even the infamous tenements of Five Points got this dense, and this is luxury housing. No, in reality, this tower has about 800 condos in its 68 floors, amounting to about 12 units per floor, about reasonable for a standard apartment building.
Some other buildings, such as those in the Bronx and Manhattan make this error, some of which I was able to catch before final production, and some of which I will never know if they're mistakes. It would be slightly counterproductive to fact-check the number of units of each building of every block. Wasn't the point of this to have my code count these things for me automatically?
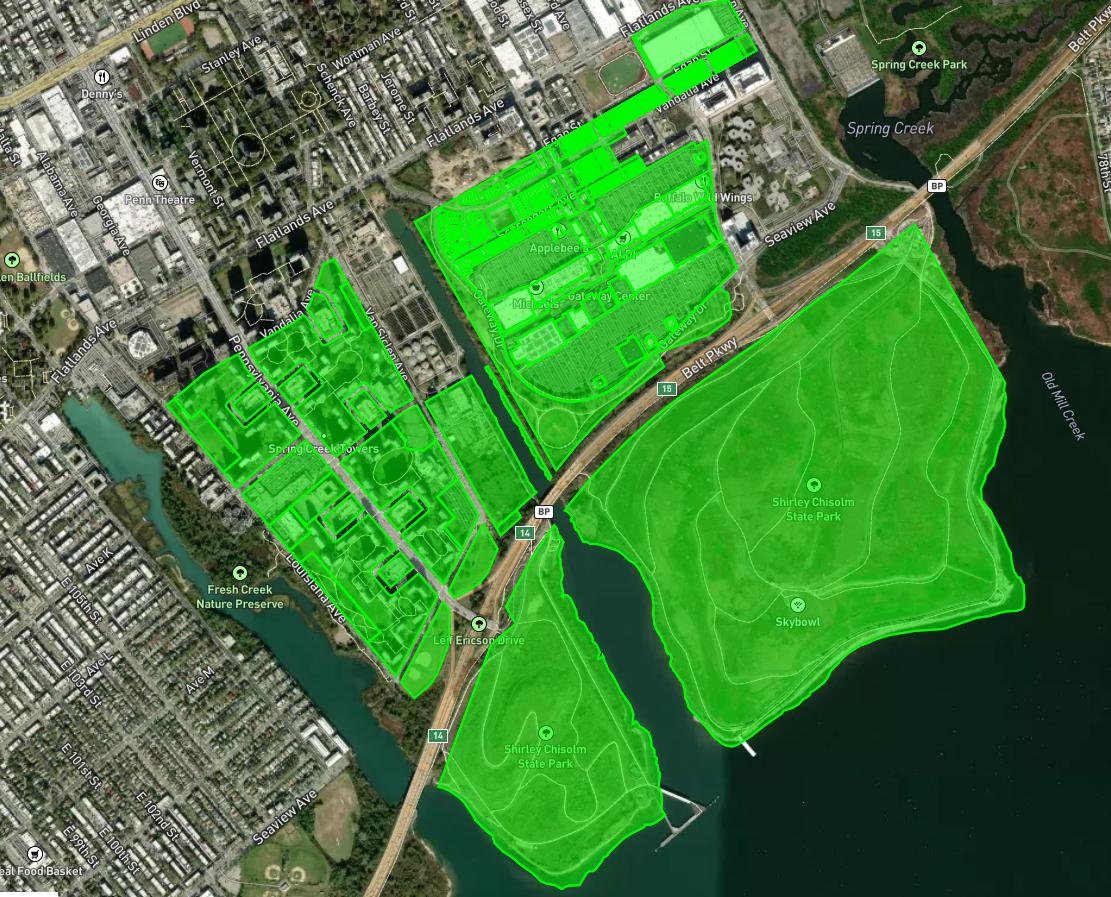
Anyhow, there was also the thing of random parks melding themselves into blocks with actual residential density, causing the entire block to have what appeared to be an abysmal total density. At the same time, it also made it appear such that a park somehow had housing in it at all. I obviously wanted neither of these things, so wherever I could, I changed the block number of these parks to a different, unused one, to isolate them from the residential blocks they should never have been in in the first place.
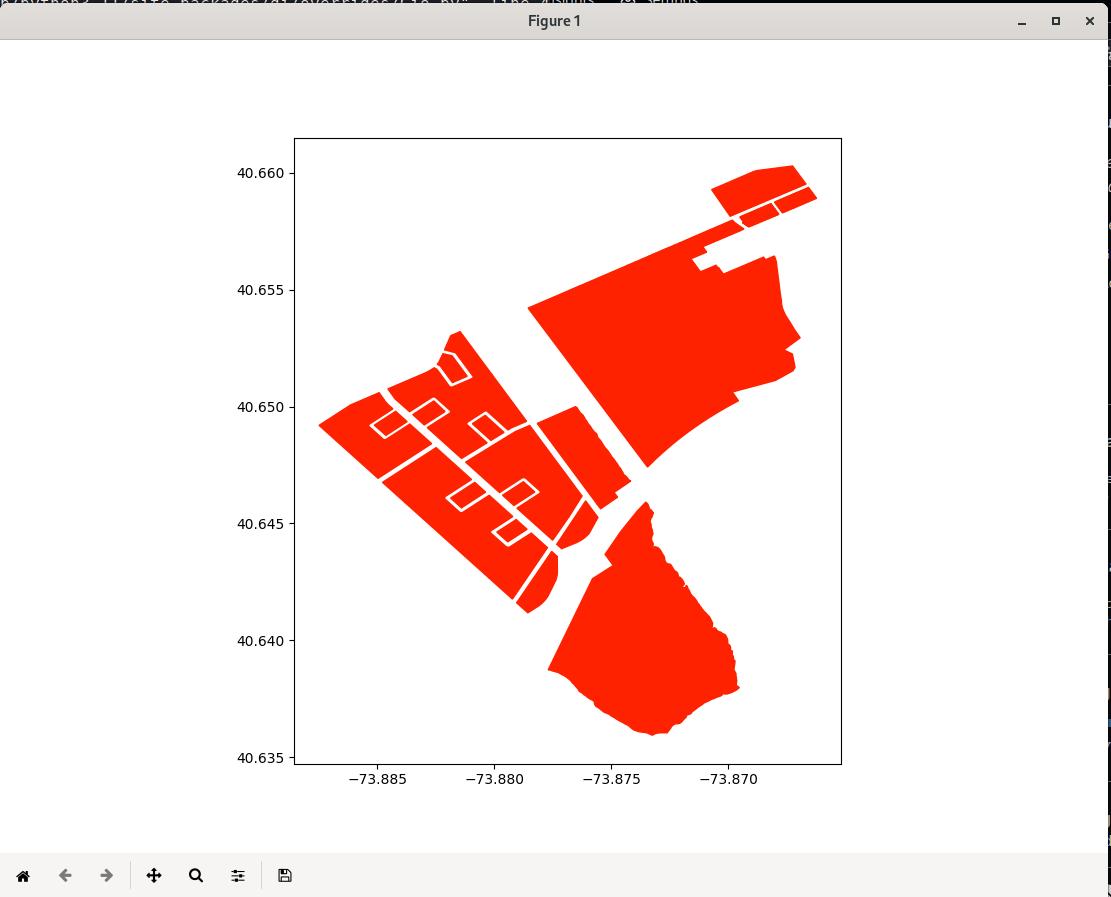
A Spring Creek block with parks included in it. It is calculated as below 20 housing units per acre.
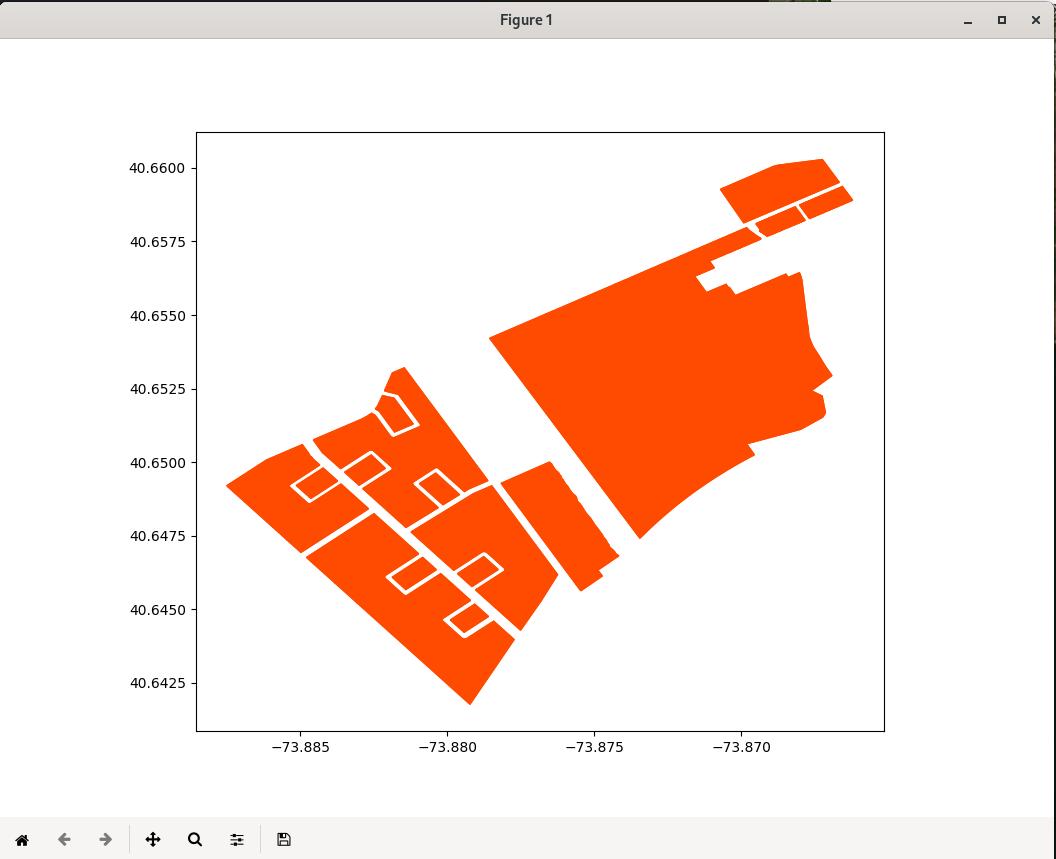
A Spring Creek block without the parks included in it. It is calculated as above 30 housing units per acre.
This freed up some spaces that looked sparse and sprawly that were actually just adjacent to parks, increasing their appeared density.
The Actual Code, I Guess
As it goes with most technical projects, the code is 20% of the content and 80% of the work. Guess that CS degree will come in handy after all.
The code, as it's completed now, appears quite simple. There are four major components to it: the central data structure, color coding, the calculations, and the rendering.
1. Our Central Data Structure: What is a Super-Dictionary?
Let's start with a regular dictionary. Just like in any standard linguistic dictionary, a dictionary in many programming languages is just a set of value pairs, an index and its definition. The index is a representation of what the definition points to, or where it's supposed to be. If jump is defined as the act of leaping from the ground, then in a dictionary, the index is "jump", and the definition or value is "act of leaping from the ground", and in Python (the language I used to make this map), it would be written as such:
        dict = {
			"jump" = "act of leaping from the ground"
        }
For my purposes, I desgined one ZoLa block to fit in one such dictionary. We are able to make the definition of a dictionary index yet another dictionary, meaning we can put dictionaries inside dictionaries. I made one borough to fit in these nested dictionaries, which I affectionately call "super dictionaries". If each block dictionary looks like this:
       	 block = {
        "sum_area_sqft": 0,
        "sum_units_res": 0,
        "coords_list": [],
        "density_acre": 0
        }
then each borough "super-dictionary" looks like this:
totaldict = {
    block_1525: {
        "sum_area_sqft": 0,
        "sum_units_res": 0,
        "coords_list": [],
        "density_acre": 0
    },
    block_1526: {
        "sum_area_sqft": 0,
        "sum_units_res": 0,
        "coords_list": [],
        "density_acre": 0
    }
}
2. The Calculations
This super-data structure allows us to effectively store and organize our numbers on area and residential units, as well as the coordinates of the lots making up the block, quickly adding blocks to the super dictionary when we find a new block or adding area or units to the block when we find new lots.
I made sure only the blocks we actually had in the dataset would be in the borough's super-dictionary with this function:
def dict_block_checker(dict, block):
    if block not in dict:
        dict[block] = {
        "sum_area_sqft": 0,
        "sum_units_res": 0,
        "coords_list": [],
        "density_acre": 0
        }
and did the actual counting, calculating, and density value processing with this sequence that goes through our .json file output and parses it:
with open('../data/1-data.json') as f:
    data = json.load(f)

    for i in data['features']:

        #check if block exists, make new dict entry if not
        dict_block_checker(mnh_super_dict, i['properties']['block'])

        #add to block area
        mnh_super_dict[i['properties']['block']]["sum_area_sqft"] += i['properties']['lotarea']

        #add to block res unit count
        mnh_super_dict[i['properties']['block']]["sum_units_res"] += i['properties']['unitsres']

        #add to coordinate list
        mnh_super_dict[i['properties']['block']]["coords_list"].append(i['geometry']['coordinates'][0][0])

    #in a loop, calculate density by block in the super-dict
    for i in mnh_super_dict.values():
        i["density_acre"] = i["sum_units_res"] / (i["sum_area_sqft"] / 43560)
You will notice I have Manhattan-centric language in this snippet of code. This is not on accident, I am in fact lazy. I didn't want to make a super-super-data structure for the city as a whole, so I just went ahead and copied the code 5 times over for each borough. Hooray for laziness!
3. Color Coding
I made 3 functions to define the values of each channel in the R-G-B color space: one for red, one for green, and one for blue. The mapping of density by color in a broad, easily visible color gradient is important, because density in NYC can vary WILDLY from 1-acre sized mansions in the outer Bronx to 68-story luxury apartment towers that fit in the space of half a block in downtown Queens. We need colors for all possible points of the density spectrum in New York.
Each of these three functions take density as their sole parameter, and gives a particular color channel value in response to the density value, which can effectively range from 0 to around 1100, after which it appears as a vaguely increasingly bright pink.
def draw_red(density):
    if (density >= 0 and density <= 80):
        return 1
    elif (density > 80 and density <= 160):
        return (2-(0.0125)*density)
    elif (density > 160 and density <= 240):
        return 0
    elif (density > 240 and density <= 320):
        return ((0.0125)*density-3)
    elif (density > 320):
        return 1

def draw_green(density):
    if (density >= 0 and density <= 80):
        return (0.0125*density)
    elif (density > 80 and density <= 160):
        return 1
    elif (density > 160 and density <= 240):
        return (3-(0.0125)*density)
    elif (density > 240 and density <= 320):
        return 0
    elif (density > 320 and density <= 400):
        return (0.00625)*density-2
    else:
        return 0.75

def draw_blue(density):
    if (density >= 0 and density <= 160):
        return 0
    elif (density > 160 and density <= 240):
        return ((0.0125)*density-2)
    elif (density > 240):
        return 1
The exact multipliers are meant to fit within the 0-1 color channel scale of our Python graphing tool: Matplotlib's Pyplot. Some other tools may use a 0-255 scale, but this one does not.
4. Plotting the Py
Now for some Pyplot syntax! This isn't much more complicated than setting some settings, and turning numbers into points on a graph.
I made sure the aspect ratio is 1:1 for latitude and latitude using ax.set_aspect.
I then went ahead and added every x coordinate in the lot coordinate list into a set of plottable points in the x axis, did the same for every y coordinate. I filled in the lot with the density color, making sure that every block without residential units gets rendered without color, then repeated this for all lots in the block, then repeated ALL of that stuff for every block in the borough. (Each borough has this rendering process)
    plt.figure()
    ax = plt.gca()
    ax.set_aspect('equal', adjustable='box')

    #in a loop, render each block
    for i in mnh_super_dict.values():
        # print(i["density_acre"])
        for j in i["coords_list"]:
            xs, ys = zip(*j)
            if i["density_acre"] > 1:
                plt.fill(xs,ys, color=(draw_red(i["density_acre"]), draw_green(i["density_acre"]), draw_blue(i["density_acre"])))
            else:
                plt.fill(xs,ys, color=(0,0,0))
By the way, I am not very good at making this process efficient, so each borough map takes about 3 minutes to render, and the file for each render is already several megabytes.
This is why the following images are by the borough. I regret to inform that combining all the boroughs into one large image breaks most computers' image rendering software before it makes it to the screen.
The Results
The first few things that may jump out at you are the white spaces for highways, and the black spaces for parks and... the middle of midtown Manhattan? Well, there are no houses in highways or parks, and definitely not in blocks devoted solely to business buildings, so I guess that makes sense. However, there are some other interesting things this map allows us to see...
In the next article, which will be a part 2 to this one! Sorry... it is getting a little long....